CSI Box
A measurement and experimentation platform for scientific research of wireless sensing applications
Introduction
What is Channel State Information (CSI)?
RF signals like WiFi (2.4/5GHz) and WiGig (60GHz) can be used beyond transmission of data.
A promising area of research is on using RF signals for sensing the environment.
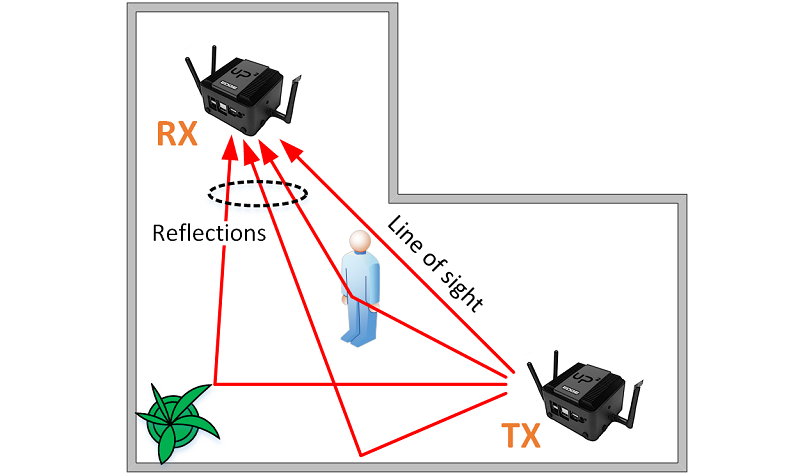
This is because the RF signal generated by the transmitter propagates through multiple paths, such as direct propagation (radiation),
reflection and scattering, and superimposes at the receiver, carrying the information of the characteristics of the propagated environment, the so-called
Channel State Information (CSI).
The best known application is the radar system used to localize airplanes.
What applications are using CSI?
The CSIBox provides wireless sensing service which can be used to implement a variety of applications ranging from user localization and tracking, line-of-sight path identification, passive human sensing, motion recognition and home & wellness monitoring.
A comprehensive survey on possible WiFi sensing applications using CSI can be found here.
Our provided Python software module helps researchers to collect and analyze wireless signal features (CSI) in real time so as to fast prototype innovative sensing research and applications.
The essential advantage of the CSIBox is the possibility to perform simultaneous sensing in both WiFi and WiGig spectrum bands, which creates the opportunity for designing novel sensing applications.
Characteristics of RF propagation captured by CSI.
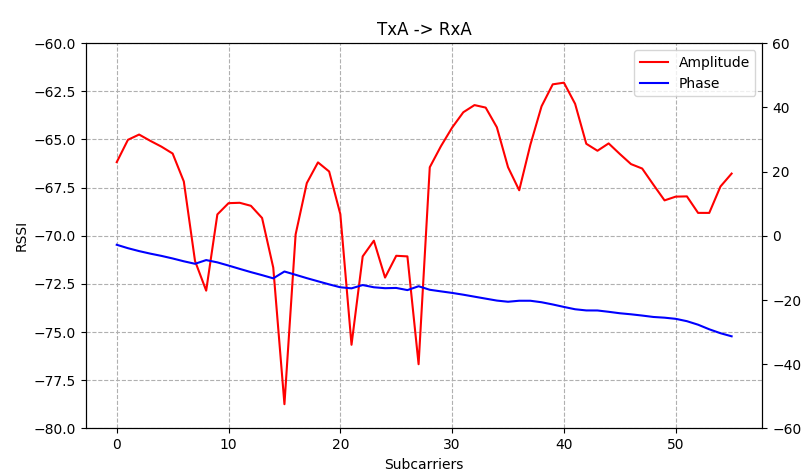
Example of CSI captured with WiFi interface (information about phase and amplitude for each OFDM subcarrier is provided).
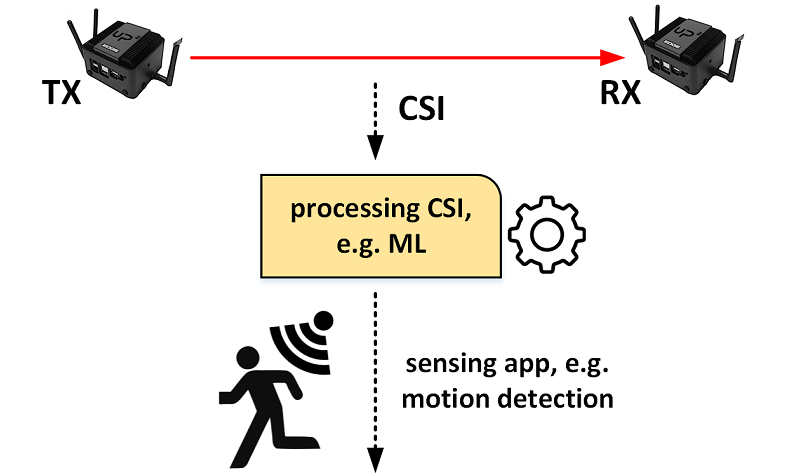
Processing CSI by sensing applications.
Hardware
The platforms currently available are shown below.
The platform is powerful enough to fully utilize the WiGig link, i.e. 1.6 Gbps with iperf (TCP/IP) running on the node. Note, that customization is possible, e.g. 2x WiFi, 2x WiGig interfaces, or larger CPU. Moreover, the CSI box can be extended with AI module or battery packs.
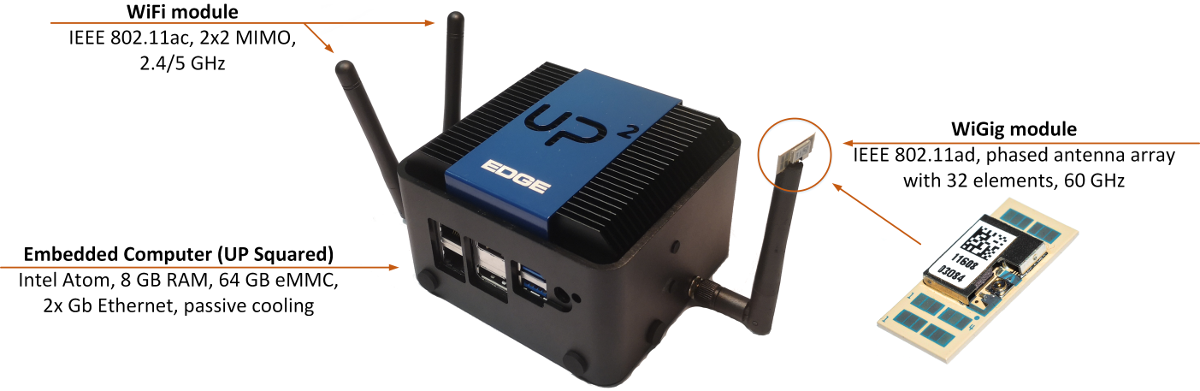
CSI Box UP Squared
Embedded CSI box based on Intels UP Squared architecture
Software
Each CSI box is running up-to-date Linux system (Ubuntu 18.04, Linux kernel 5.5.1). For the collection of CSI samples for both WiFi and WiGig interfaces we provide a simple Python interface.
Example 1: Collecting CSI in 2.4 GHz band.
Python example shows how to collect CSI samples using the WiFi interface (802.11ac). The WiFiCsiPlotHelper displays the amplitude and phase of the wireless channel between the first transmit and receive antenna. In case of MIMO the CSI is plotted for each antenna path. Note that the CSI can be measured for all overheard frames. However, it is also possible to filter the CSI reports for the frames with a specific source MAC address, bandwidth and/or frame type. The resolution of CSI is 8 bit.
from csiBox import WiFiCsiReceiver, WiFiCsiPlotHelper

# plot using helper class
plotHelper = WiFiCsiPlotHelper()
plotHelper.set_amplitude_limits(-80,-60)
plotHelper.set_phase_limits(-60,60)

# configure CSI receiver
srcMacAddresses = ["48:5d:60:77:02:42","04:ea:56:f3:21:5e"]
csiReceiver = WiFiCsiReceiver(interface)
csiReceiver.set_mac_address_filter(srcMacAddresses)
csiReceiver.start()

# main loop for CSI reception and plotting
while True:
    csiEntry = csiReceiver.receive()
    plotHelper.plot(csiEntry)
Example 2: Collecting CSI in 60 GHz band.
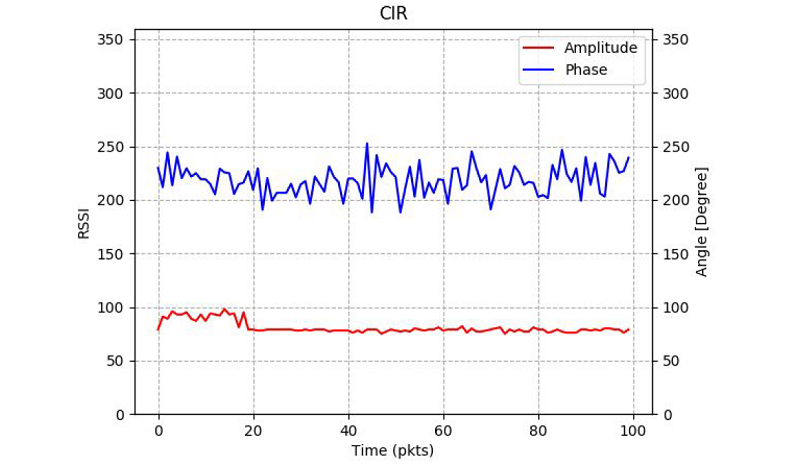
Python example shows how to collect CSI samples using the WiGig interface (802.11ad). Note that in contrast to WiFi a single value (amplitude and phase) for the whole antenna array, i.e. the strongest path, is reported.
from csiBox import WiGigCirReceiver

# configure CIR receiver
srcMacAddrs = ["b8:d7:af:19:a9:9b"]
cirReceiver = WiGigCirReceiver(interface)
cirReceiver.set_mac_address_filter(srcMacAddrs)
cirReceiver.set_measurement_interval(1.0)
cirReceiver.start()

while True:
    cirEntry = cirReceiver.receive()
    # amplitude values range between 0 and 178
    amplitude = cirEntry.amplitude
    # phase values are in radians
    phase = cirEntry.phase
    # transform to degrees
    phase = phase * 180 / np.pi
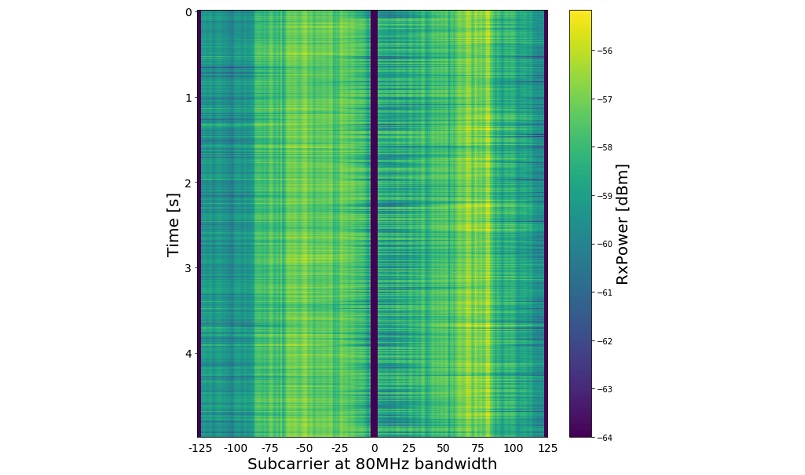
CSI collected in 2.4 GHz band: information about phase and amplitude for each OFDM subcarrier is provided.
WiFi spectrogram: colors encode frequency power levels.
CSI collected in 60 GHz band: phase and amplitude of the strongest path shown per packet.
FAQ
Q.: Is the 802.11ac chip suitable to perform Angle of Arrival (AoA) estimation?
We analyzed the phase offsets between RF chains of the 802.11ac (Intel 9260) chip in both 2.4 and 5 GHz bands. Results reveal that the phase offset between receive antennas is influenced by random phase rotations, which however can be corrected as shown in our paper here.
Following figure shows the estimated AoA vs. the ground truth (taken from paper).
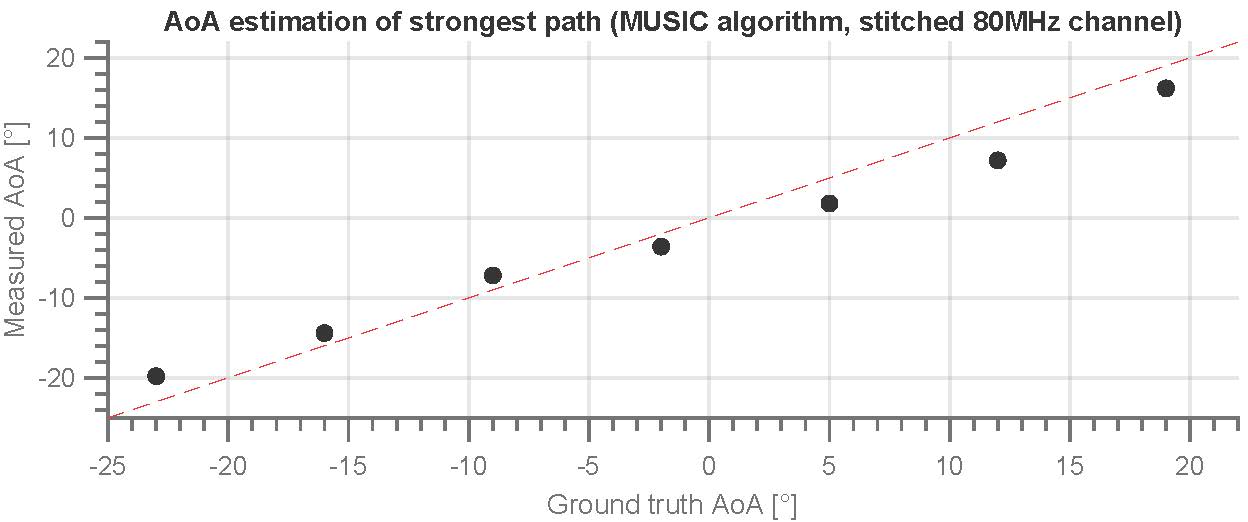
AoA estimated vs. ground truth.